Introduction to ShareInvestor Membership
For a very long time, I have always utilized Google Finance and SGX StockFacts to perform stocks’ screening and analysis on a regular basis. However, after Google decided to drop their data for the finance site and SGX StockFacts come short of my increased needs for higher level of comparison, I needed another viable option.
And that’s when i bit the bullet and subscribed to ShareInvestor WebPro, a web-based membership plan that offers a wide array of financial information. After using it for some time, I seriously feel that it is a great tool to have – I personally saved tons of time by getting a quick snapshot of the company’s financials over long periods of time.
If you are interested to find out more about the membership, you are in luck!
In the 1st ever ShareInvestor Membership Review, we are going to delve deep into the Shareinvestor features (only available to premium members) in our 3-part series.
You can find our 1st part of the series here.
In this 2nd part of the series, we will touch on “Financials”.
Financials

Quick Summary:
- Financial analysis is the core part of a fundamental review of any company;
- There are clear advantages in using Shareinvestor Membership for stock financial analysis;
- In this article I’ll provide a walkthrough of a simple financial analysis of Perfect Shape Medical Limited (HKEX: 1830) using Shareinvestor features
- Why I love Shareinvestor’s financial features.
Financial Analysis
Financial Analysis is a very important part of the research every investor should do. However, it’s not always easy to gather and assess the information needed.
With that in mind I’ll walk you through a simple financial analysis of Perfect Shape Medical Limited (HKEX: 1830) and I’ll be using Shareinvestor Membership “Financials” feature to demonstrate how easy it becomes.
First of all, let me warn you that you shouldn’t dig into financial info without any previous knowledge of the company’s business. Every time I research a company I start by understanding the company’s business and growth strategy so that I can have a critical perspective on the numbers.
With that disclaimer out of the way, I’ll jump right into the financial analysis of Perfect Shape, which is a company that’s been on my watch-list for the past few weeks.
STEP 1: Gather main financial statements
The 3 main financial statements include Income Statement, Balance Sheet and Cash Flow Statement.
I like to use the annual historical data of the previous 5 years, which implies going through the annual reports and exporting the statements to my spreadsheet. Sometimes this is very time consuming and requires me to “treat” the information in excel before I can use it.
After signing up for the Shareinvestor Membership, this task takes just a few seconds. Let me show you how:
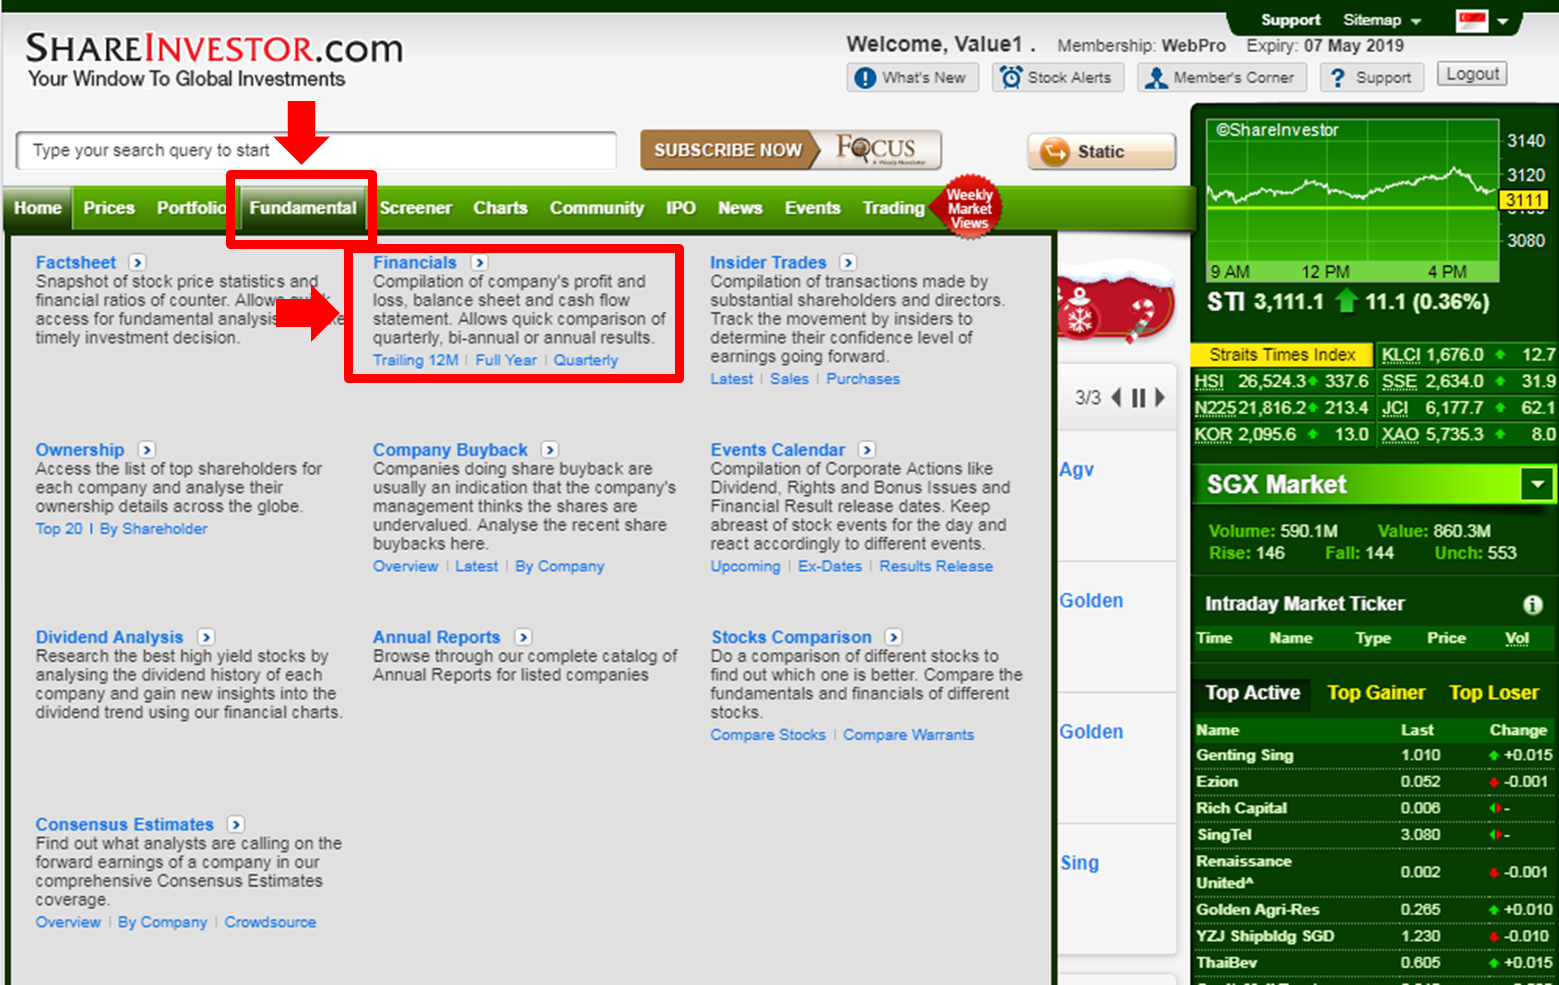
Go to Fundamental Tab -> Financials.
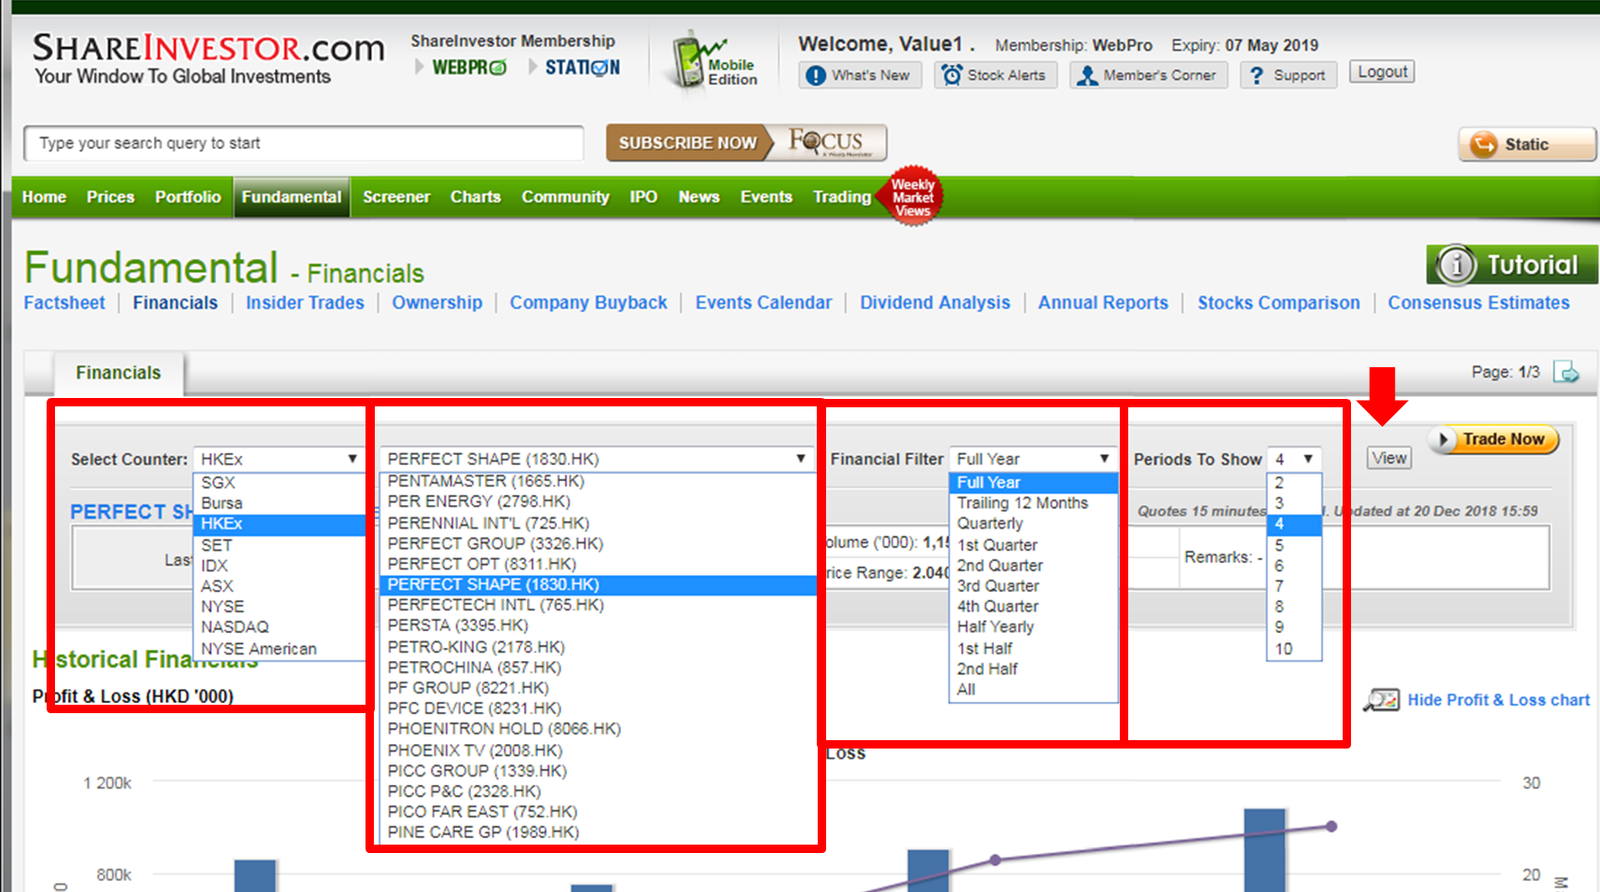
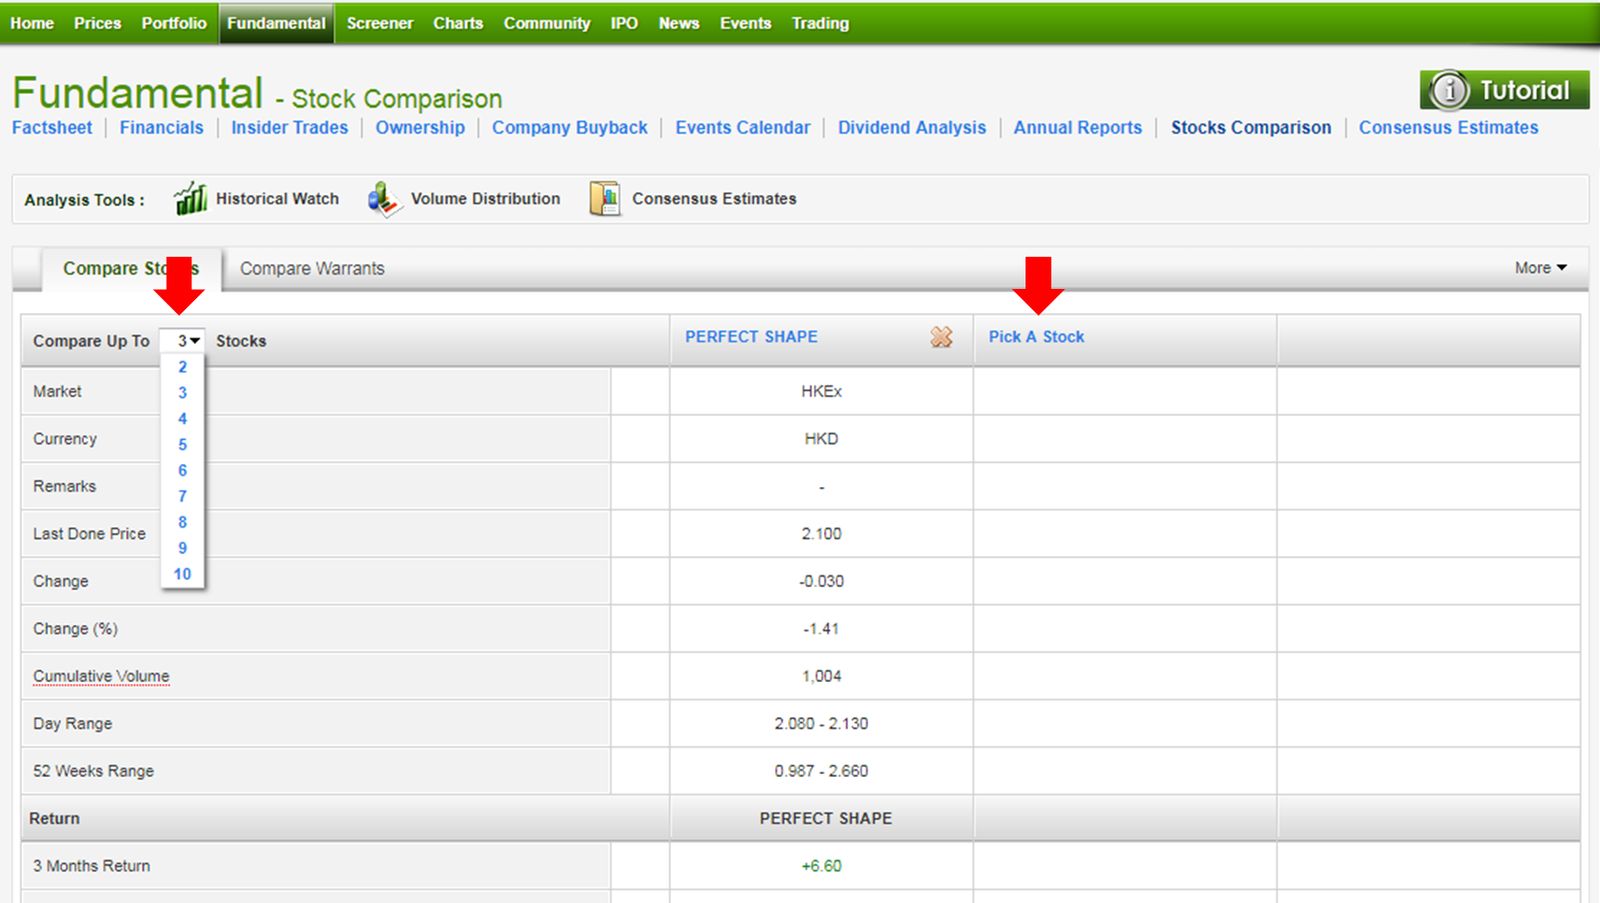
Select the Exchange, Company name, type of report and number of reports you want to see.
STEP 2: Assess financial performance
The 1st thing to go through here is the Revenue performance – Are sales growing steadily and at what pace? Or is it bouncing up and down showing an erratic pattern?
As you can see, the information we want shows up as the 1st thing on the screen in the “Profit & Loss” segment (see below).
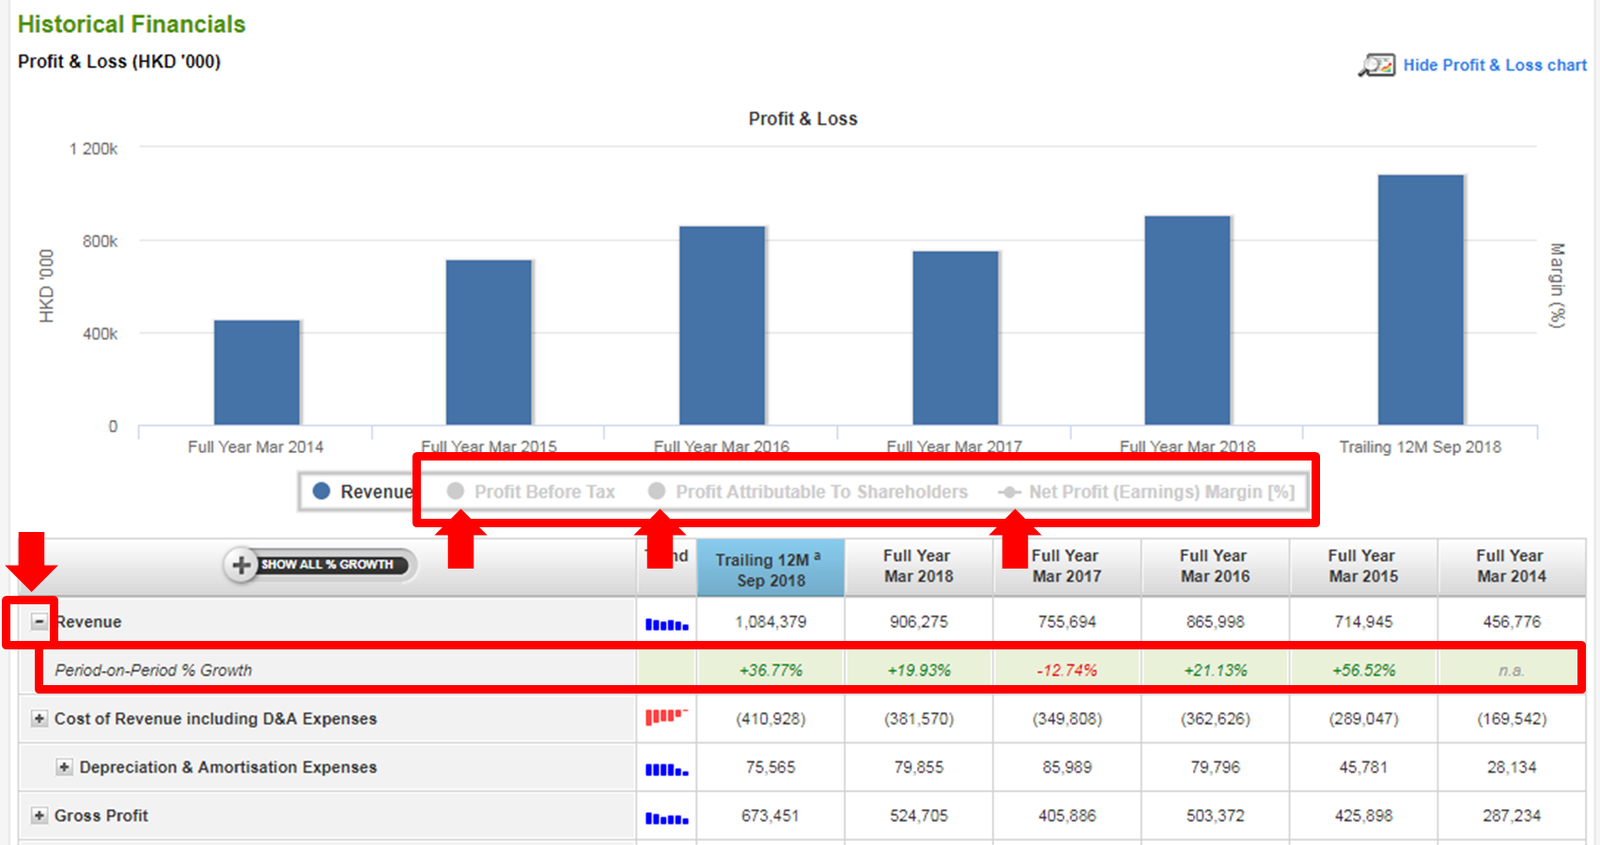
You can deselect the other and you get a clean chart of the revenue performance.
In addition, when you click on the “+” button on the left, you also get the growth from one year to the next. Fascinating, isn’t it?
Bear in mind to seek out explanations about any strange values/patterns by reading the company’s reports or analyst report.
Next up, we have the Gross Margin. We just need to divide the Gross Profit by Revenue, or we can just check it here (keep scrolling down):
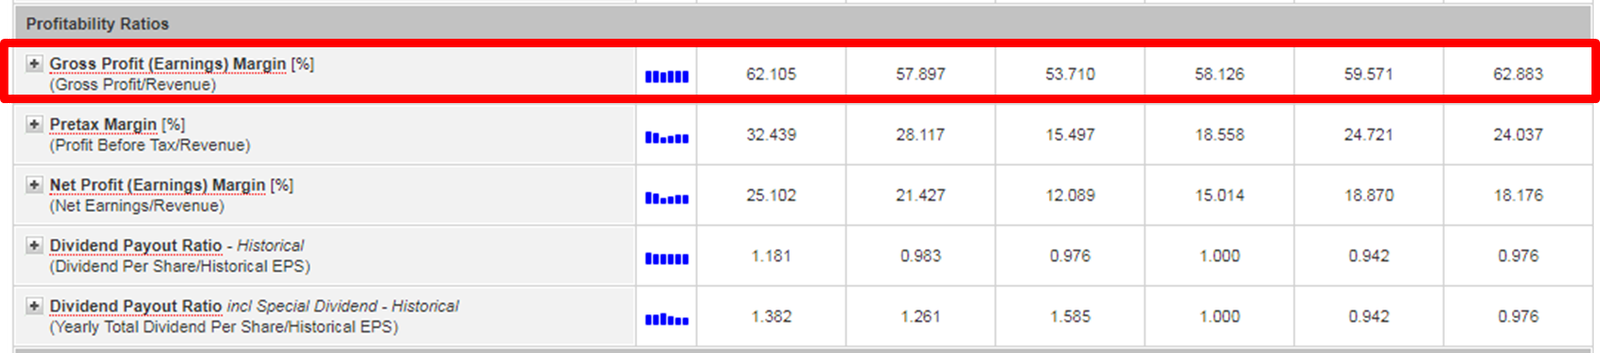
Any clear ascending or descending trend should have an explanation and you should assess the sustainability of the trend.
Finally, we turn to the Operational Margin, which in this case is the same as the pre-tax Margin because Perfect Shape doesn’t incur in financial costs.
In Perfect Shape’s case, its gross margins are around the 53% to 62% range. However, net profit margins are increasing steadily from 18% to 25%. At this stage, I will zoom in to understand why the 2 set of profit margins are different – is it because the expenses are fixed leading to higher margins?
STEP 3: Assessment of Financial Position
I usually start this with some liquidity ratios to check the company’s solvability, but I’ve got to say I just love the balance sheet representation on Shareinvestor.
They provide a simple overview that allows a great first impression of the financial position.
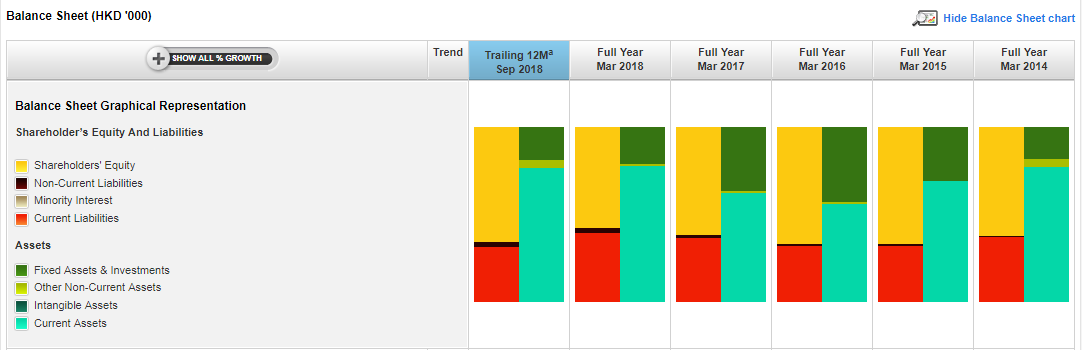
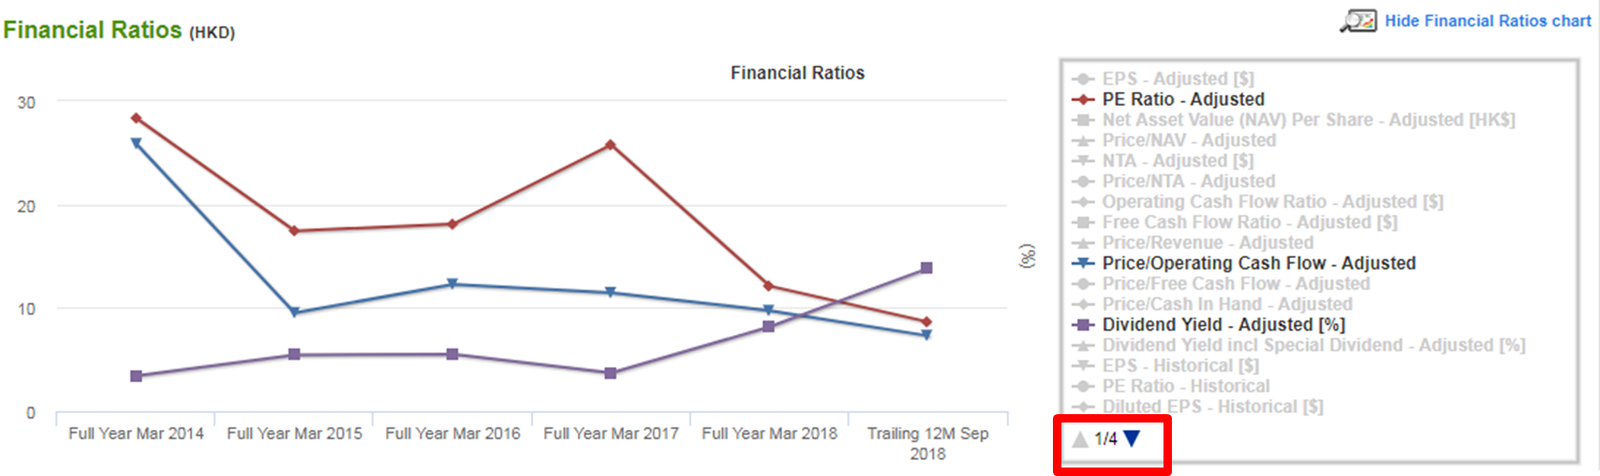
What’s more, many of the common financial ratios are already computed and shown across the different years too (see below):
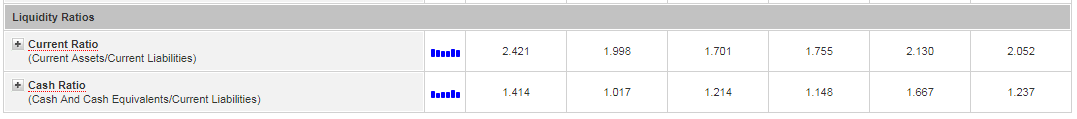
Another great thing about Shareinvestor membership is that you can see [below the name], the formula for the metric and an explanation of how it works. There may be even links to more detailed articles about it!
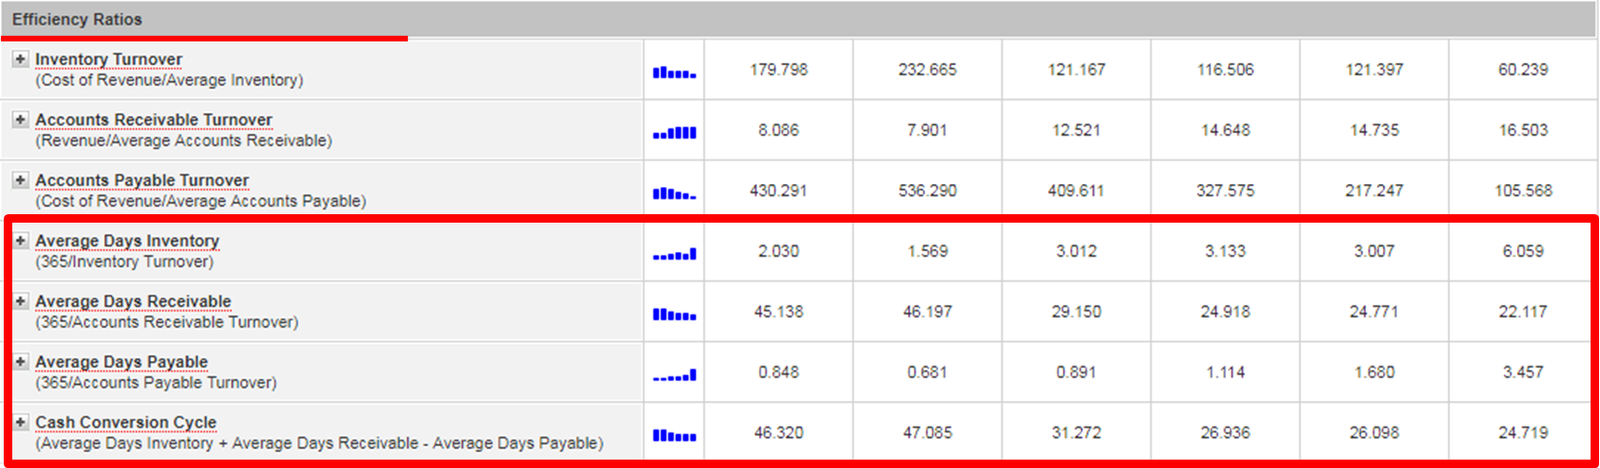
Worried about how some companies offer credit to some customers and never got it back?
Now you can quickly glance through these Efficiency Ratios such as the cash conversion cycle, which is the time it takes for the company to convert a sale in cash (see below).
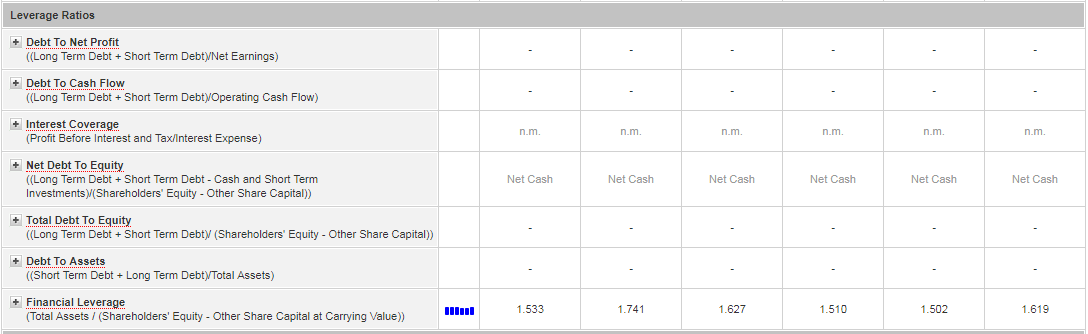
Next I like to check debt levels and assess the company’s ability to repay it. And Shareinvestor provides the ratios at one glance!
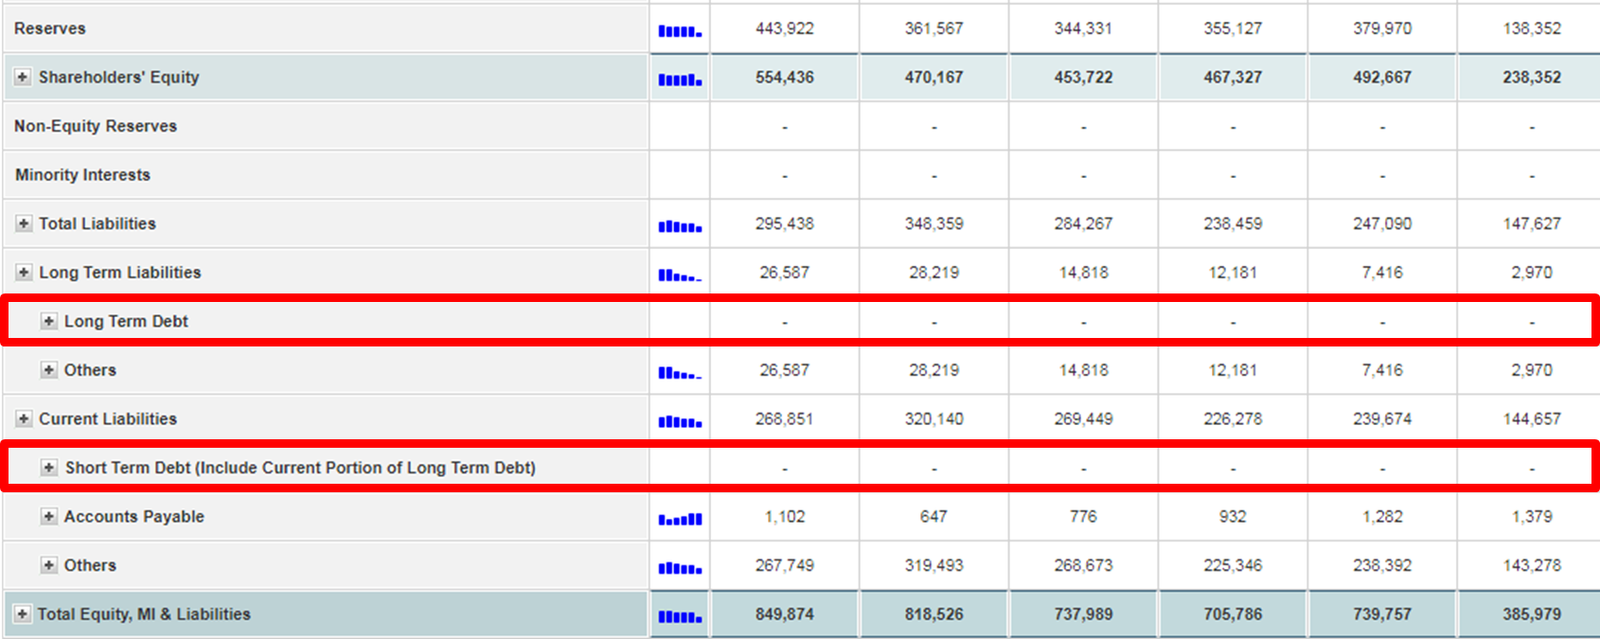
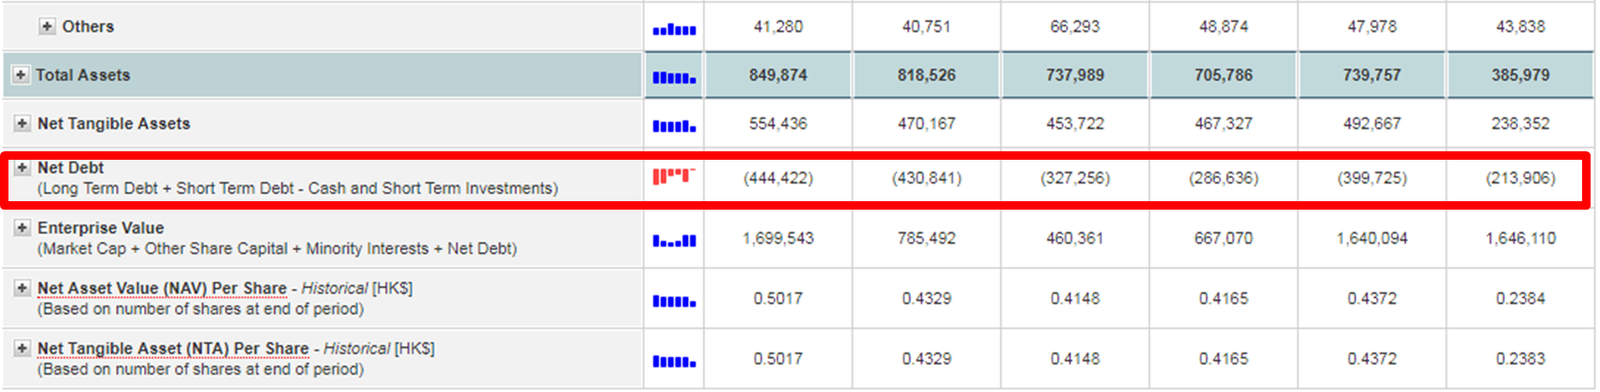
In our example, the company isn’t financed with debt and is net cash so I’m not going to do any further diligence. However, you can check the section for leverage ratios as well.
STEP 4. Assessing cash generation
You’ve probably heard the expression: “Cash is King”.
And yes, I consider this an important part of my financial analysis because cashflow is not so easily manipulated as compared to earnings. Free cash flow can be used to acquire other businesses, buy back shares and issue dividends.
In general, I like to have an overview of the total amount of cash used or generated from operating, investing and financing activities.
I used to make a chart just with the total amounts, but I guess I won’t anymore because it’s already here, right before the cash flow statement.
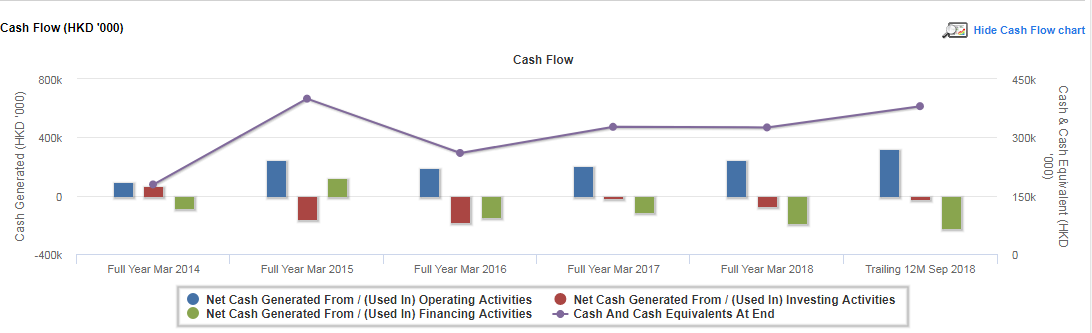
It’s a good sign that cash from operating activities is always positive, preferably with an ascending trend, but it’s important to understand if that is sustainable.
My next step is to screen for high amounts that account for the majority of cash used/generated from investing and financing activities.
Capital expenditures (Capex) are an important account and you should search annual reports for the explanations about where the company is spending that money.
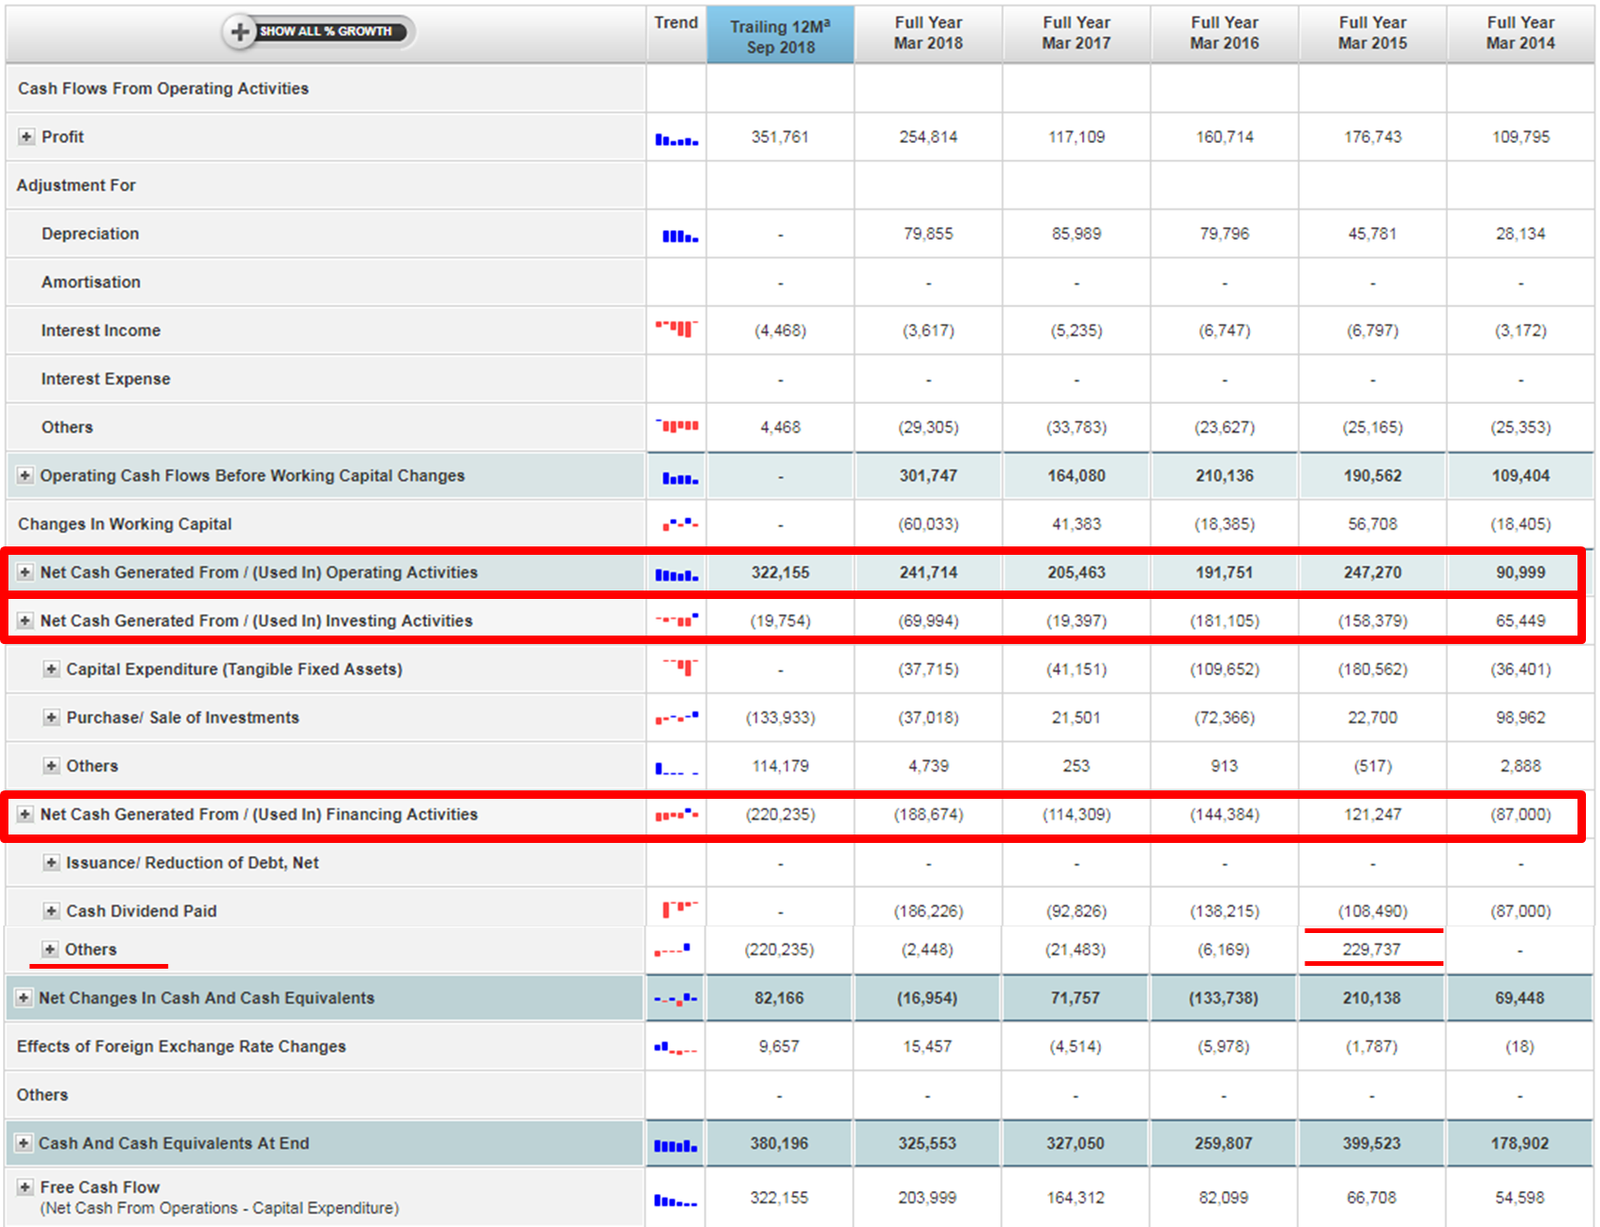
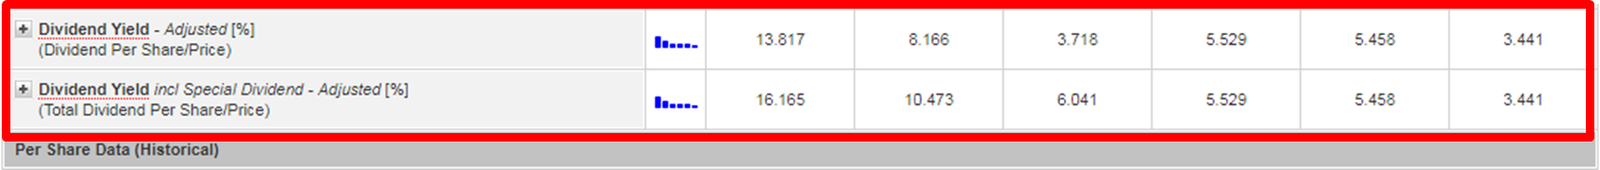
You can see Perfect Shape is debt free, but under its financing activities you can see the amounts paid in dividends. You’ll find the dividend payout as well as the dividend yield (shown below):

Notice that in 2015, there’s a positive HK$230 million under the “others” account in the financing activities. You’ll find this was the amount in proceeds from issuance of ordinary shares.
Finally, the calculation of free cash flow is also computed for us hassle-free!

In a nutshell, we gather the benefits of using ShareInvestor’s Financials Tool:
- I can select a big number of years (up to 10 years!) for the financial statements;
- I can choose to see annual, biannual and quarter statements;
- Little bars before the numbers show the trend of each and every account;
- All the metrics and growth rates are already computed;
- You can see PE Ratio, P/NAV and many financial ratios at one glance;
- (my favorite!) There are over 60 ratios computed and I can see all of them represented in a chart;
Conclusion
That’s it! Notice that this is a very simple financial analysis walkthrough, designed to show you how simple and quickly it is to use Shareinvestor’s financial features.
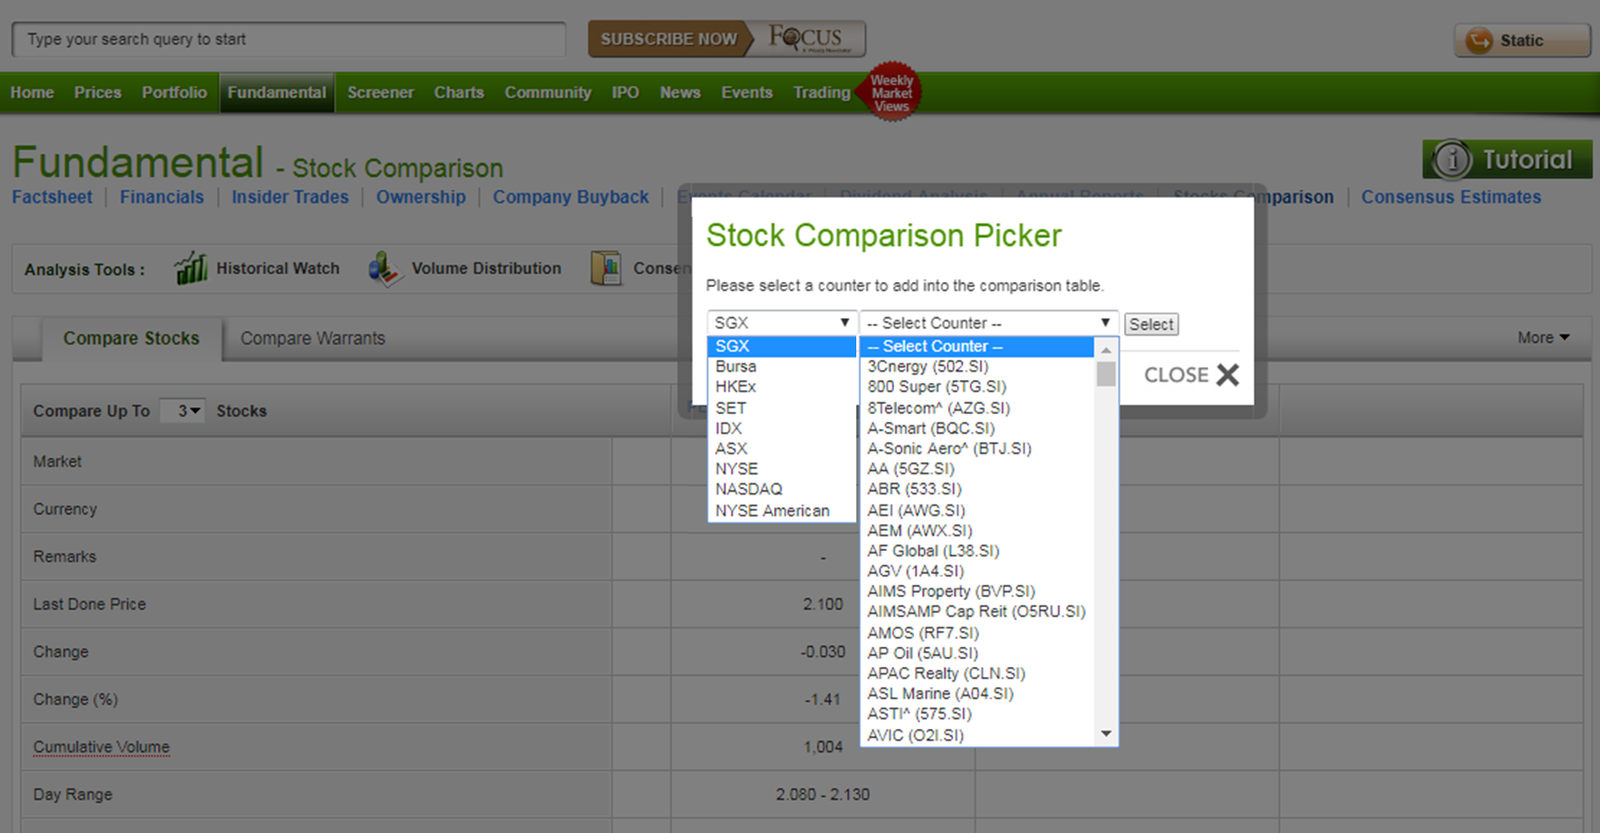
This work should be followed by some multiples analysis which includes peers comparison. You can do that inside Shareinvestor “Stocks comparison” feature which is also amazing due to the extent of information you can use, comparing up to 10 stocks at a time. 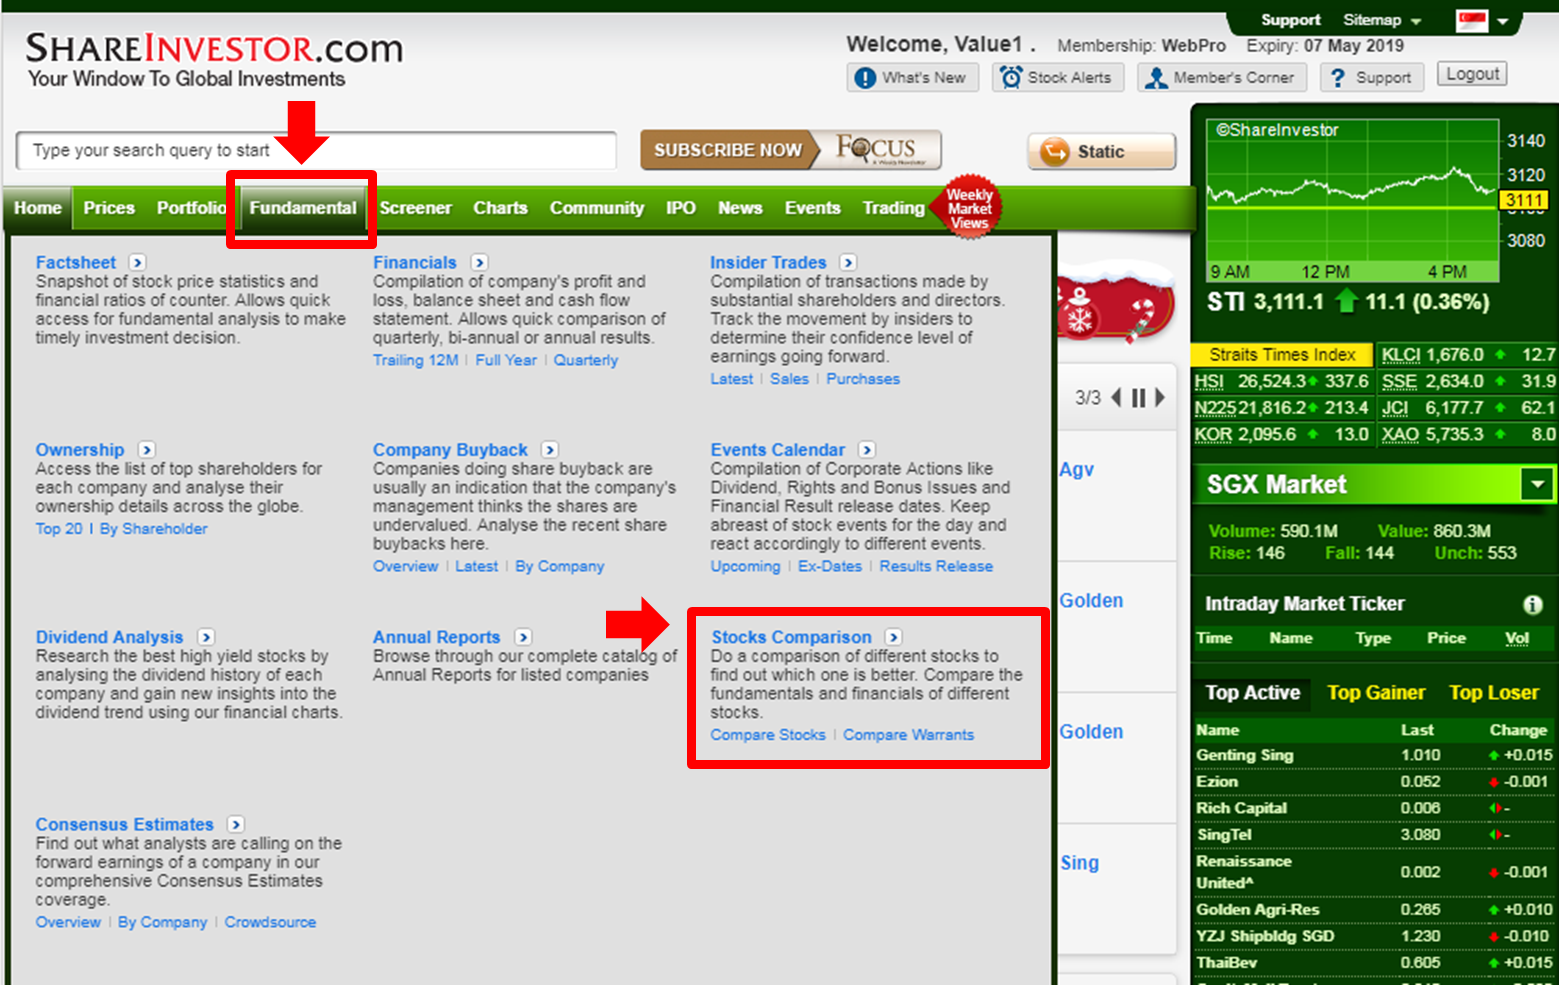
Let me tell you that I’m honestly well impressed with Shareinvestor membership features. It reduces my work by at least 50% and it saves me 70% of the time, and let’s face it, time is money!
This is just a part of the value this membership has to offer. Check out part 1 of this review here for some more insights if you haven’t already.
Convinced of the value ShareInvestor’s membership can bring for you? Find out more here before its all too late!
