Market Indices P/E (Price to Earnings) Ratio for Asia Stock Exchanges
Every month, I like to do a simple tabulation of the P/E ratios in Asia’s markets. It helps me to gauge how cheap/expensive the stock markets are right now and also to compare against the stocks’ P/E ratio on a basic level.
Things to zoom into for the 2 tables below are:
- Symbol – You would be able to see 8 different markets in Asia with the descriptions. Examples include Kuala Lumpur Composite Index (KLCI) and Straits Times Index (STI).
- Last Price – It refers to the last price when it is trading at.
- 52 week range – You can literally find out where the market sits at within the 52 week range, whether its near a 52 week low or high!
- Estimated P/E ratio (ttm) – In case you don’t know, ‘ttm’ means trailing twelve months. It’s also easy to compare the P/E ratios across the various markets!
- Estimated P/B ratio (mrq) – ‘mrq’ cites most recent quarter. While P/B ratio is lesser used for stock indices, it serves as a simple measure if the markets are cheap/expensive.
Monthly Update: Dec 2016
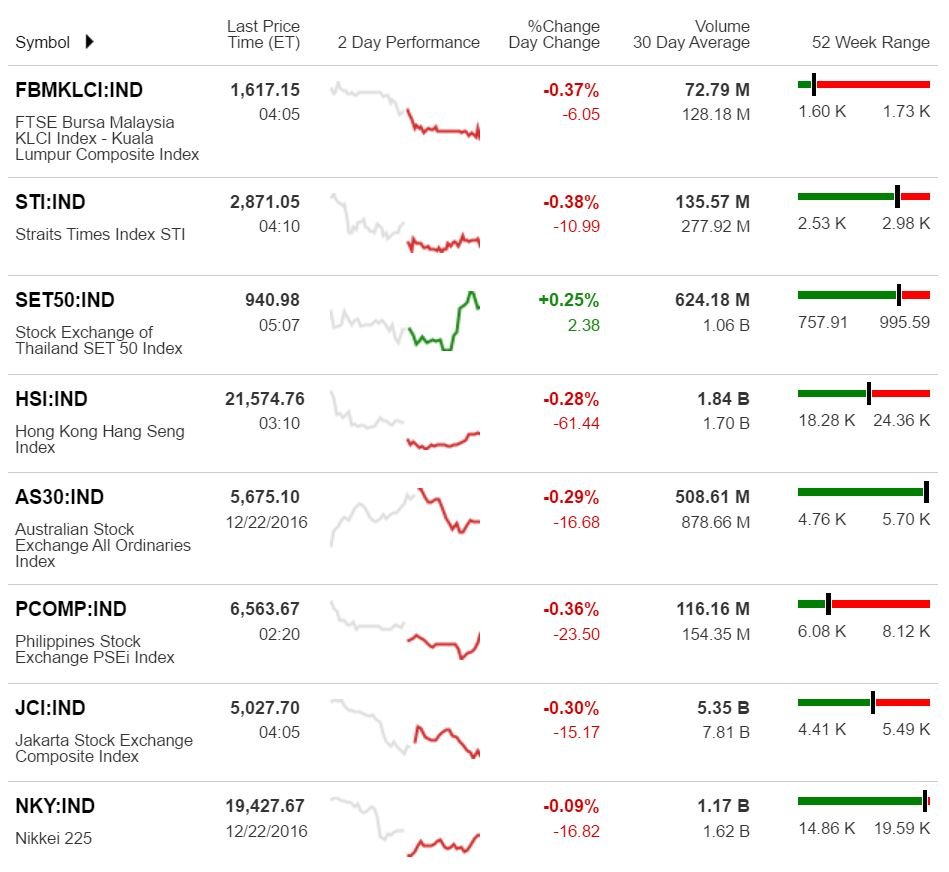
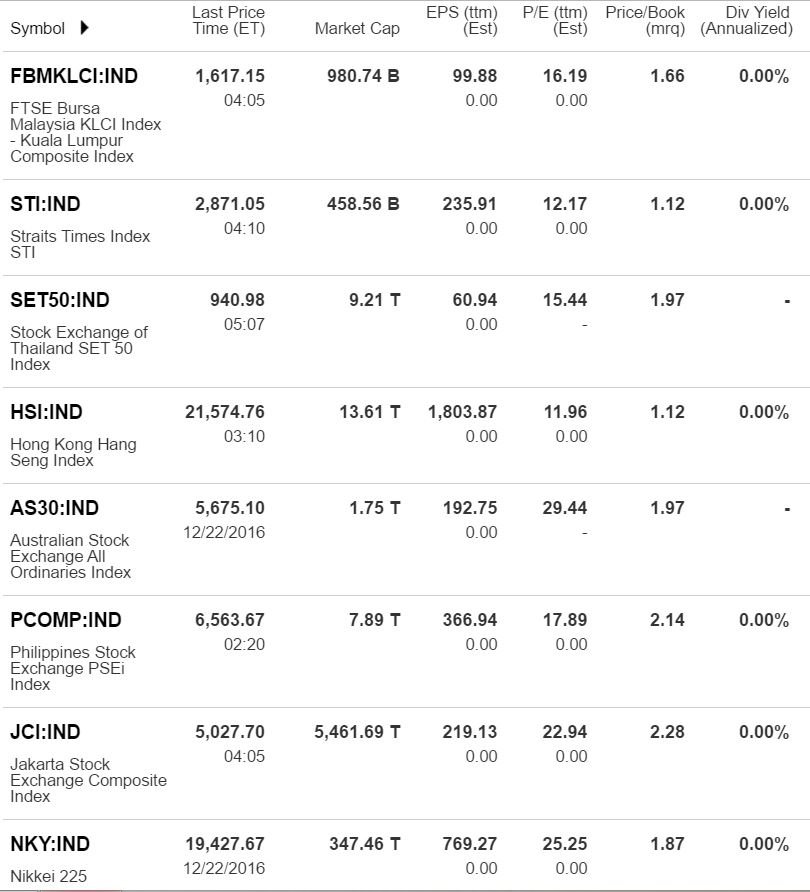
The KLCI is currently trading close to its 52 week low. However, its P/E ratio at 16.2 is not comparatively cheaper than that of STI and HIS at 12.2 and 12 respectively. Same goes for the PCOMP.
